In the rapidly evolving world of energy storage, LiFePO4 (Lithium Iron Phosphate) batteries have emerged as a frontrunner due to their exceptional performance, longevity, and safety features. Understanding the voltage characteristics of these batteries is crucial for their optimal performance and longevity. This comprehensive guide to LiFePO4 voltage charts will provide you with a clear understanding of how to interpret and utilize these charts, ensuring you get the most out of your LiFePO4 batteries.
What is a LiFePO4 Voltage Chart?
Are you curious about the hidden language of LiFePO4 batteries? Imagine being able to decipher the secret code that reveals a battery’s state of charge, performance, and overall health. Well, that’s exactly what a LiFePO4 voltage chart allows you to do!
A LiFePO4 voltage chart is a visual representation that illustrates the voltage levels of a LiFePO4 battery at various states of charge (SOC). This chart is essential for understanding the battery’s performance, capacity, and health. By referencing a LiFePO4 voltage chart, users can make informed decisions regarding charging, discharging, and overall battery management.
This chart is crucial for:
1. Monitoring battery performance
2. Optimizing charging and discharging cycles
3. Extending battery lifespan
4. Ensuring safe operation
Basics of LiFePO4 Battery Voltage
Before diving into the specifics of the voltage chart, it’s important to understand some basic terms related to battery voltage:
First, what’s the difference between nominal voltage and actual voltage range?
Nominal voltage is the reference voltage used to describe a battery. For LiFePO4 cells, this is typically 3.2V. However, the actual voltage of a LiFePO4 battery fluctuates during use. A fully charged cell can reach up to 3.65V, while a discharged cell may drop to 2.5V.
Nominal Voltage: The optimal voltage at which the battery operates best. For LiFePO4 batteries, this is typically 3.2V per cell.
Fully Charged Voltage: The maximum voltage a battery should reach when fully charged. For LiFePO4 batteries, this is 3.65V per cell.
Discharge Voltage: The minimum voltage a battery should reach when being discharged. For LiFePO4 batteries, this is 2.5V per cell.
Storage Voltage: The ideal voltage at which the battery should be stored when not in use for prolonged periods. This helps maintain battery health and reduce capacity loss.
BSLBATT’s advanced Battery Management Systems (BMS) constantly monitor these voltage levels, ensuring optimal performance and longevity of their LiFePO4 batteries.
But what causes these voltage fluctuations? Several factors come into play:
- State of Charge (SOC): As we saw in the voltage chart, voltage decreases as the battery discharges.
- Temperature: Cold temperatures can temporarily lower battery voltage, while heat can increase it.
- Load: When a battery is under heavy load, its voltage may dip slightly.
- Age: As batteries age, their voltage characteristics can change.
But why is understanding these voltage basics so important? Well, it allows you to:
- Accurately gauge your battery’s state of charge
- Prevent overcharging or over-discharging
- Optimize charging cycles for maximum battery life
- Troubleshoot potential issues before they become serious
Are you starting to see how a LiFePO4 voltage chart can be a powerful tool in your energy management toolkit? In the next section, we’ll take a closer look at voltage charts for specific battery configurations. Stay tuned!
LiFePO4 Voltage Chart (3.2V, 12V, 24V, 48V)
The voltage table and graph of LiFePO4 batteries are essential for evaluating the charge and health of these lithium iron phosphate batteries. It shows the voltage change from full to discharged state, helping users to accurately understand the instantaneous charge of the battery.
Below is a table of charge state and voltage correspondence for LiFePO4 batteries of different voltage levels, such as 12V, 24V and 48V. These tables are based on a reference voltage of 3.2V.
| SOC Status | 3.2V LiFePO4 Battery | 12V LiFePO4 Battery | 24V LiFePO4 Battery | 48V LiFePO4 Battery |
| 100% Charging | 3.65 | 14.6 | 29.2 | 58.4 |
| 100% Rest | 3.4 | 13.6 | 27.2 | 54.4 |
| 90% | 3.35 | 13.4 | 26.8 | 53.6 |
| 80% | 3.32 | 13.28 | 26.56 | 53.12 |
| 70% | 3.3 | 13.2 | 26.4 | 52.8 |
| 60% | 3.27 | 13.08 | 26.16 | 52.32 |
| 50% | 3.26 | 13.04 | 26.08 | 52.16 |
| 40% | 3.25 | 13.0 | 26.0 | 52.0 |
| 30% | 3.22 | 12.88 | 25.8 | 51.5 |
| 20% | 3.2 | 12.8 | 25.6 | 51.2 |
| 10% | 3.0 | 12.0 | 24.0 | 48.0 |
| 0% | 2.5 | 10.0 | 20.0 | 40.0 |
What insights can we glean from this chart?
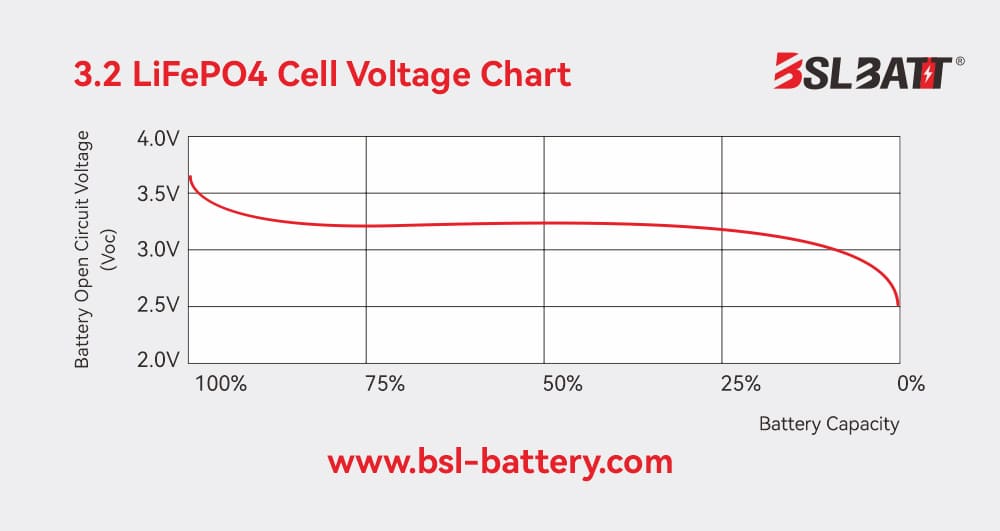
First, notice the relatively flat voltage curve between 80% and 20% SOC. This is one of LiFePO4′s standout features. It means the battery can deliver consistent power over most of its discharge cycle. Isn’t that impressive?
But why is this flat voltage curve so advantageous? It allows devices to operate at stable voltages for longer periods, enhancing performance and longevity. BSLBATT’s LiFePO4 cells are engineered to maintain this flat curve, ensuring reliable power delivery in various applications.
Did you notice how quickly the voltage drops below 10% SOC? This rapid voltage decline serves as a built-in warning system, signaling that the battery needs recharging soon.
Understanding this single cell voltage chart is crucial because it forms the foundation for larger battery systems. After all, what is a 12V 24V or 48V battery but a collection of these 3.2V cells working in harmony.
Understanding the LiFePO4 Voltage Chart Layout
A typical LiFePO4 voltage chart includes the following components:
- X-Axis: Represents the state of charge (SoC) or time.
- Y-Axis: Represents the voltage levels.
- Curve/Line: Shows the fluctuating charge or discharge of the battery.
Interpreting the Chart
- Charging Phase: The rising curve indicates the battery’s charging phase. As the battery charges, the voltage rises.
- Discharging Phase: The descending curve represents the discharging phase, where the battery’s voltage drops.
- Stable Voltage Range: A flat portion of the curve indicates a relatively stable voltage, representing the storage voltage phase.
- Critical Zones: The fully charged phase and deep discharge phase are critical zones. Exceeding these zones can significantly reduce the battery’s lifespan and capacity.
3.2V Battery Voltage Chart Layout
The nominal voltage of a single LiFePO4 cell is typically 3.2V. The battery is fully charged at 3.65V and fully discharged at 2.5V. Here is a 3.2V battery voltage graph:
12V Battery Voltage Chart Layout
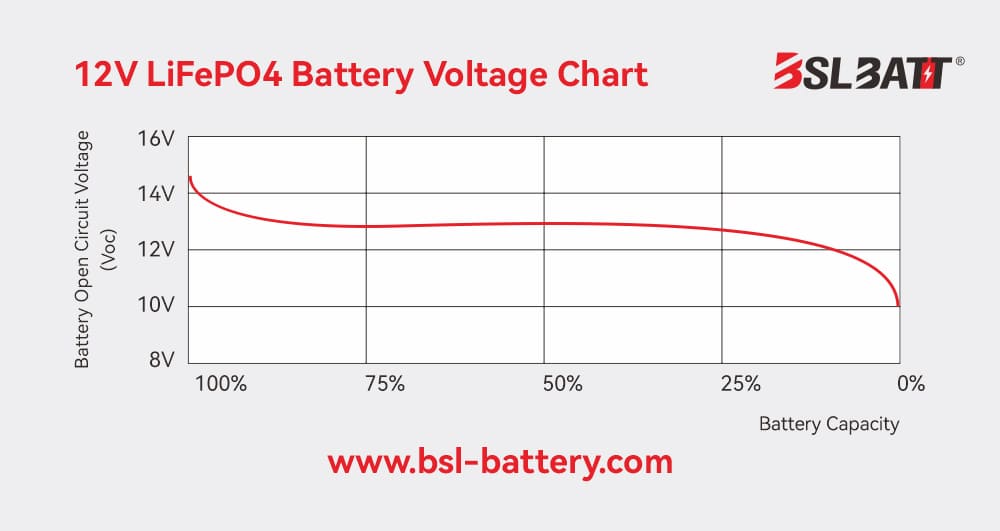
A typical 12V LiFePO4 battery consists of four 3.2V cells connected in series. This configuration is popular for its versatility and compatibility with many existing 12V systems. The 12V LiFePO4 battery voltage graph below shows how the voltage drops with battery capacity.
What interesting patterns do you notice in this Graph?
First, observe how the voltage range has expanded compared to the single cell. A fully charged 12V LiFePO4 battery reaches 14.6V, while the cut-off voltage is around 10V. This wider range allows for more precise state of charge estimation.
But here’s a key point: the characteristic flat voltage curve we saw in the single cell is still evident. Between 80% and 30% SOC, the voltage only drops by 0.5V. This stable voltage output is a significant advantage in many applications.
Speaking of applications, where might you find 12V LiFePO4 batteries in use? They’re common in:
- RV and marine power systems
- Solar energy storage
- Off-grid power setups
- Electric vehicle auxiliary systems
BSLBATT’s 12V LiFePO4 batteries are engineered for these demanding applications, offering stable voltage output and long cycle life.
But why choose a 12V LiFePO4 battery over other options? Here are some key benefits:
- Drop-in replacement for lead-acid: 12V LiFePO4 batteries can often directly replace 12V lead-acid batteries, offering improved performance and longevity.
- Higher usable capacity: While lead-acid batteries typically allow only 50% depth of discharge, LiFePO4 batteries can safely be discharged to 80% or more.
- Faster charging: LiFePO4 batteries can accept higher charging currents, reducing charging times.
- Lighter weight: A 12V LiFePO4 battery is typically 50-70% lighter than an equivalent lead-acid battery.
Are you starting to see why understanding the 12V LiFePO4 voltage chart is so crucial for optimizing battery use? It allows you to accurately gauge your battery’s state of charge, plan for voltage-sensitive applications, and maximize the battery’s lifespan.
LiFePO4 24V and 48V Battery Voltage Chart Layouts
As we scale up from 12V systems, how do the voltage characteristics of LiFePO4 batteries change? Let’s explore the world of 24V and 48V LiFePO4 battery configurations and their corresponding voltage charts.
First, why would someone opt for a 24V or 48V system? Higher voltage systems allow for:
1. Lower current for the same power output
2. Reduced wire size and cost
3. Improved efficiency in power transmission
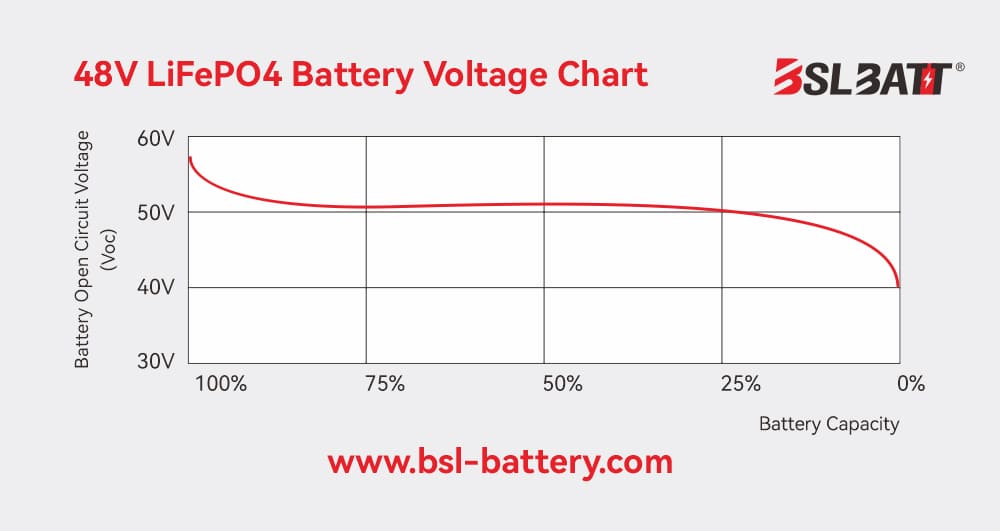
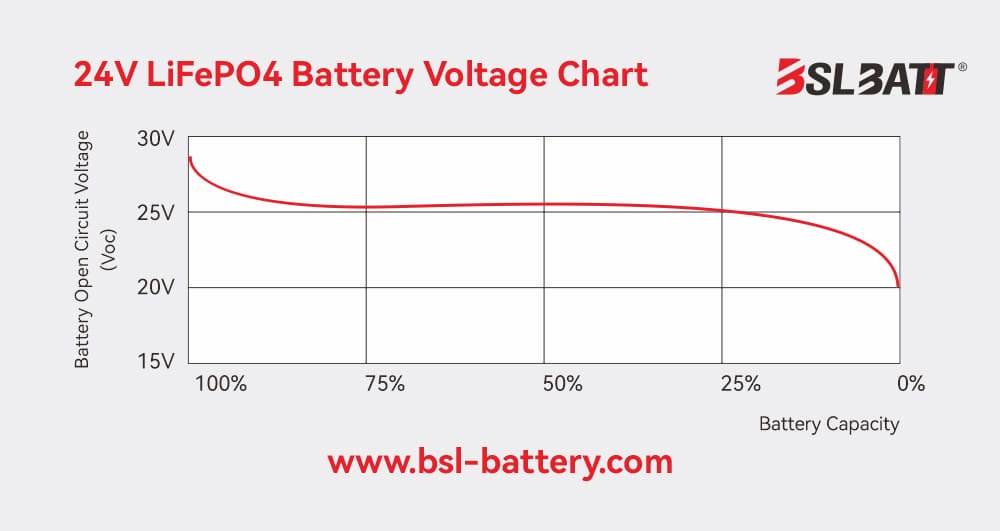
Now, let’s examine the voltage charts for both 24V and 48V LiFePO4 batteries:
Do you notice any similarities between these charts and the 12V chart we examined earlier? The characteristic flat voltage curve is still present, just at higher voltage levels.
But what are the key differences?
- Wider voltage range: The difference between fully charged and fully discharged is larger, allowing for more precise SOC estimation.
- Higher precision: With more cells in series, small voltage changes can indicate larger shifts in SOC.
- Increased sensitivity: Higher voltage systems may require more sophisticated Battery Management Systems (BMS) to maintain cell balance.
Where might you encounter 24V and 48V LiFePO4 systems? They’re common in:
- Residential or C&I solar energy storage
- Electric vehicles (especially 48V systems)
- Industrial equipment
- Telecom backup power
Are you beginning to see how mastering LiFePO4 voltage charts can unlock the full potential of your energy storage system? Whether you’re working with 3.2V cells, 12V batteries, or larger 24V and 48V configurations, these charts are your key to optimal battery management.
LiFePO4 Battery Charging & Discharging
The recommended method for charging LiFePO4 batteries is the CCCV method. This involves two stages:
- Constant Current (CC) Stage: The battery is charged at a constant current until it reaches a predetermined voltage.
- Constant Voltage (CV) Stage: The voltage is kept constant while the current gradually decreases until the battery is fully charged.
Below is a lithium battery chart showing the correlation between SOC and LiFePO4 voltage:
| SOC (100%) | Voltage (V) |
| 100 | 3.60-3.65 |
| 90 | 3.50-3.55 |
| 80 | 3.45-3.50 |
| 70 | 3.40-3.45 |
| 60 | 3.35-3.40 |
| 50 | 3.30-3.35 |
| 40 | 3.25-3.30 |
| 30 | 3.20-3.25 |
| 20 | 3.10-3.20 |
| 10 | 2.90-3.00 |
| 0 | 2.00-2.50 |
The state of charge indicates the amount of capacity that can be discharged as a percentage of the total battery capacity. The voltage increases when you charge a battery. The SOC of a battery depends on how much it is charged.
LiFePO4 Battery Charging Parameters
The charging parameters of LiFePO4 batteries are critical to their optimal performance. These batteries perform well only under specific voltage and current conditions. Adhering to these parameters not only ensures efficient energy storage, but also prevents overcharging and prolongs the battery’s life. Proper understanding and application of charging parameters are key to maintaining the health and efficiency of LiFePO4 batteries, making them a reliable choice in a variety of applications.
| Characteristics | 3.2V | 12V | 24V | 48V |
| Charging Voltage | 3.55-3.65V | 14.2-14.6V | 28.4V-29.2V | 56.8V-58.4V |
| Float Voltage | 3.4V | 13.6V | 27.2V | 54.4V |
| Maximum Voltage | 3.65V | 14.6V | 29.2V | 58.4V |
| Minimum Voltage | 2.5V | 10V | 20V | 40V |
| Nominal Voltage | 3.2V | 12.8V | 25.6V | 51.2V |
LiFePO4 Bulk, Float, And Equalize Voltages
- Proper charging techniques are vital for maintaining the health and longevity of LiFePO4 batteries. Here are the recommended charging parameters:
- Bulk Charging Voltage: The initial and highest voltage applied during the charging process. For LiFePO4 batteries, this is typically around 3.6 to 3.8 volts per cell.
- Float Voltage: The voltage applied to maintain the battery at a fully charged state without overcharging. For LiFePO4 batteries, this is typically around 3.3 to 3.4 volts per cell.
- Equalize Voltage: A higher voltage used to balance the charge among individual cells within a battery pack. For LiFePO4 batteries, this is typically around 3.8 to 4.0 volts per cell.
| Types | 3.2V | 12V | 24V | 48V |
| Bulk | 3.6-3.8V | 14.4-15.2V | 28.8-30.4V | 57.6-60.8V |
| Float | 3.3-3.4V | 13.2-13.6V | 26.4-27.2V | 52.8-54.4V |
| Equalize | 3.8-4.0V | 15.2-16V | 30.4-32V | 60.8-64V |
BSLBATT 48V LiFePO4 Voltage Chart
BSLBATT uses intelligent BMS to manage our battery voltage and capacity. In order to extend the battery life, we have made some restrictions on the charging and discharging voltages. Therefore, the BSLBATT 48V battery will refer to the following LiFePO4 Voltage Chart:
| SOC Status | BSLBATT Battery |
| 100% Charging | 55 |
| 100% Rest | 54.5 |
| 90% | 53.6 |
| 80% | 53.12 |
| 70% | 52.8 |
| 60% | 52.32 |
| 50% | 52.16 |
| 40% | 52 |
| 30% | 51.5 |
| 20% | 51.2 |
| 10% | 48.0 |
| 0% | 47 |
In terms of BMS software design, we set four levels of protection for charging protection.
- Level 1, because BSLBATT is a 16-string system, we set the required voltage to 55V, and the average single cell is about 3.43, which will prevent all batteries from overcharging;
- Level 2, when the total voltage reaches 54.5V and the current is less than 5A, our BMS will send a charging current demand of 0A, requiring charging to stop, and the charging MOS will be turned off;
- Level 3, when the single cell voltage is 3.55V, our BMS will also send a charging current of 0A, requiring charging to stop, and the charging MOS will be turned off;
- Level 4, when the single cell voltage reaches 3.75V, our BMS will send a charging current of 0A, upload an alarm to the inverter, and turn off the charging MOS.
Such a setting can effectively protect our 48V solar battery to achieve a longer service life.
Interpreting and Using LiFePO4 Voltage Charts
Now that we’ve explored voltage charts for various LiFePO4 battery configurations, you might be wondering: How do I actually use these charts in real-world scenarios? How can I leverage this information to optimize my battery’s performance and lifespan?
Let’s dive into some practical applications of LiFePO4 voltage charts:
1. Reading and Understanding Voltage Charts
First things first—how do you read a LiFePO4 voltage chart? It’s simpler than you might think:
- The vertical axis shows voltage levels
- The horizontal axis represents the state of charge (SOC)
- Each point on the chart correlates a specific voltage to an SOC percentage
For example, on a 12V LiFePO4 voltage chart, a reading of 13.3V would indicate approximately 80% SOC. Easy, right?
2. Using Voltage to Estimate State of Charge
One of the most practical uses of a LiFePO4 voltage chart is estimating your battery’s SOC. Here’s how:
- Measure your battery’s voltage using a multimeter
- Find this voltage on your LiFePO4 voltage chart
- Read the corresponding SOC percentage
But remember, for accuracy:
- Allow the battery to “rest” for at least 30 minutes after use before measuring
- Consider temperature effects – cold batteries may show lower voltages
BSLBATT’s smart battery systems often include built-in voltage monitoring, making this process even easier.
3. Best Practices for Battery Management
Armed with your LiFePO4 voltage chart knowledge, you can implement these best practices:
a) Avoid Deep Discharges: Most LiFePO4 batteries shouldn’t be discharged below 20% SOC regularly. Your voltage chart helps you identify this point.
b) Optimize Charging: Many chargers allow you to set voltage cut-offs. Use your chart to set appropriate levels.
c) Storage Voltage: If storing your battery long-term, aim for about 50% SOC. Your voltage chart will show you the corresponding voltage.
d) Performance Monitoring: Regular voltage checks can help you spot potential issues early. Is your battery not reaching its full voltage? It might be time for a check-up.
Let’s look at a practical example. Say you’re using a 24V BSLBATT LiFePO4 battery in an off-grid solar system. You measure the battery voltage at 26.4V. Referring to our 24V LiFePO4 voltage chart, this indicates about 70% SOC. This tells you:
- You have plenty of capacity left
- It’s not yet time to start your backup generator
- The solar panels are doing their job effectively
Isn’t it amazing how much information a simple voltage reading can provide when you know how to interpret it?
But here’s a question to ponder: How might voltage readings change under load versus at rest? And how can you account for this in your battery management strategy?
By mastering the use of LiFePO4 voltage charts, you’re not just reading numbers – you’re unlocking the secret language of your batteries. This knowledge empowers you to maximize performance, extend lifespan, and get the most out of your energy storage system.
How Voltage Affects LiFePO4 Battery Performance?
Voltage plays a critical role in determining the performance characteristics of LiFePO4 batteries, impacting their capacity, energy density, power output, charging characteristics, and safety.
Measuring Battery Voltage
Measuring battery voltage typically involves using a voltmeter. Here’s a general guide on how to measure battery voltage:
1. Select the Appropriate Voltmeter: Ensure that the voltmeter can measure the expected voltage of the battery.
2. Turn Off the Circuit: If the battery is part of a larger circuit, switch off the circuit before measuring.
3. Connect the Voltmeter: Attach the voltmeter to the battery terminals. The red lead connects to the positive terminal, and the black lead connects to the negative terminal.
4. Read the Voltage: Once connected, the voltmeter will display the battery’s voltage.
5. Interpret the Reading: Take note of the displayed reading to determine the battery’s voltage.
Conclusion
Understanding the voltage characteristics of LiFePO4 batteries is essential for their effective utilization in a wide range of applications. By referencing a LiFePO4 voltage chart, you can make informed decisions regarding charging, discharging, and overall battery management, ultimately maximizing the performance and lifespan of these advanced energy storage solutions.
In conclusion, the voltage chart serves as a valuable tool for engineers, system integrators, and end-users, providing vital insights into the behavior of LiFePO4 batteries and enabling the optimization of energy storage systems for various applications. By adhering to the recommended voltage levels and proper charging techniques, you can ensure the longevity and efficiency of your LiFePO4 batteries.
FAQ About LiFePO4 Battery Voltage Chart
Q: How do I read a LiFePO4 battery voltage chart?
A: To read a LiFePO4 battery voltage chart, start by identifying the X and Y axes. The X-axis typically represents the battery’s state of charge (SoC) as a percentage, while the Y-axis shows the voltage. Look for the curve that represents the battery’s discharge or charge cycle. The chart will show how voltage changes as the battery discharges or charges. Pay attention to key points like the nominal voltage (usually around 3.2V per cell) and the voltage at different SoC levels. Remember that LiFePO4 batteries have a flatter voltage curve compared to other chemistries, which means the voltage stays relatively stable over a wide SOC range.
Q: What is the ideal voltage range for a LiFePO4 battery?
A: The ideal voltage range for a LiFePO4 battery depends on the number of cells in series. For a single cell, the safe operating range is typically between 2.5V (fully discharged) and 3.65V (fully charged). For a 4-cell battery pack (12V nominal), the range would be 10V to 14.6V. It’s important to note that LiFePO4 batteries have a very flat voltage curve, meaning they maintain a relatively constant voltage (around 3.2V per cell) for most of their discharge cycle. To maximize battery life, it’s recommended to keep the state of charge between 20% and 80%, which corresponds to a slightly narrower voltage range.
Q: How does temperature affect LiFePO4 battery voltage?
A: Temperature significantly affects LiFePO4 battery voltage and performance. In general, as temperature decreases, battery voltage and capacity slightly decrease, while internal resistance increases. Conversely, higher temperatures can lead to slightly higher voltages but may reduce battery lifespan if excessive. LiFePO4 batteries perform best between 20°C and 40°C (68°F to 104°F). At very low temperatures (below 0°C or 32°F), charging should be done carefully to avoid lithium plating. Most battery management systems (BMS) adjust charging parameters based on temperature to ensure safe operation. It’s crucial to consult the manufacturer’s specifications for the exact temperature-voltage relationships of your specific LiFePO4 battery.
Post time: Oct-30-2024


